How to use the Trail’s GPS Heat Map

A new feature on our GPS units is the GolfLogix green heat map. As you reach a green on the Trail, the GPS unit will display a heat map view of the green. The arrows indicate the direction of the break, and the colors represent the speed at which the putt will break.
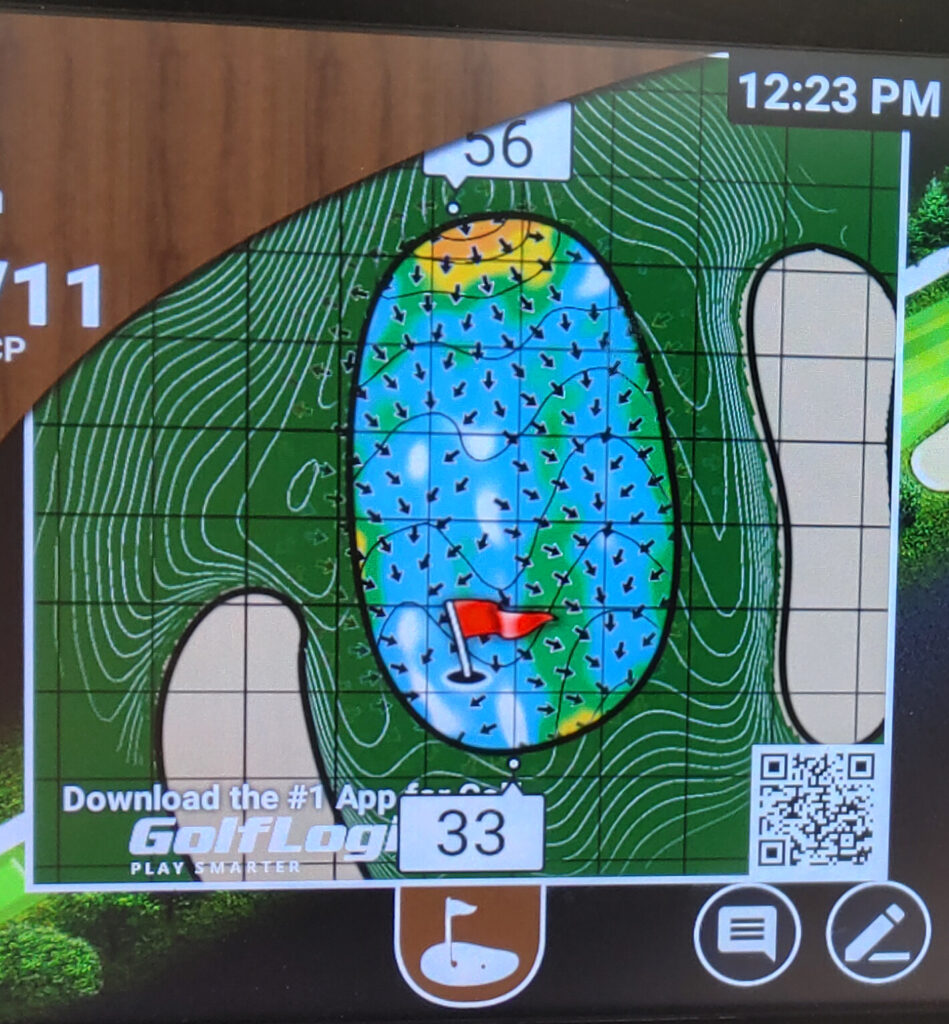
- The heat map’s color range: white, blue, green, yellow, orange, red indicate the severity of the beak from near zero percent (white) to seven percent (red).
- Arrows all point downhill
- Grid lines indicate 5-yard increments
- Contour lines indicate 3 inches of elevation change
- The closer the contour lines the steeper the slope
If you want to hide the heat map touch the white flag at the bottom of the map. To open the map, touch the same white flag on the top of the screen.